Cryptocurrency prices were on a downtrend last week, driven primarily by newly released Fed meeting notes and risk-off sentiment regarding economic indicators. The Fed expressed caution about inflation, especially since President Trump's policies will be implemented after he takes office on January 20th. Meanwhile, spot crypto ETFs recorded outflows starting Wednesday, January 8th.
Bitcoin
Bitcoin price fell from a high of $102,733 to a low of $91,188 and finally closed at $94,547.
Technical analysis shows that the price has broken above the previous low high and pushed back into the H4 demand zone. This means that although prices have turned bearish, they are still in bullish territory overall.
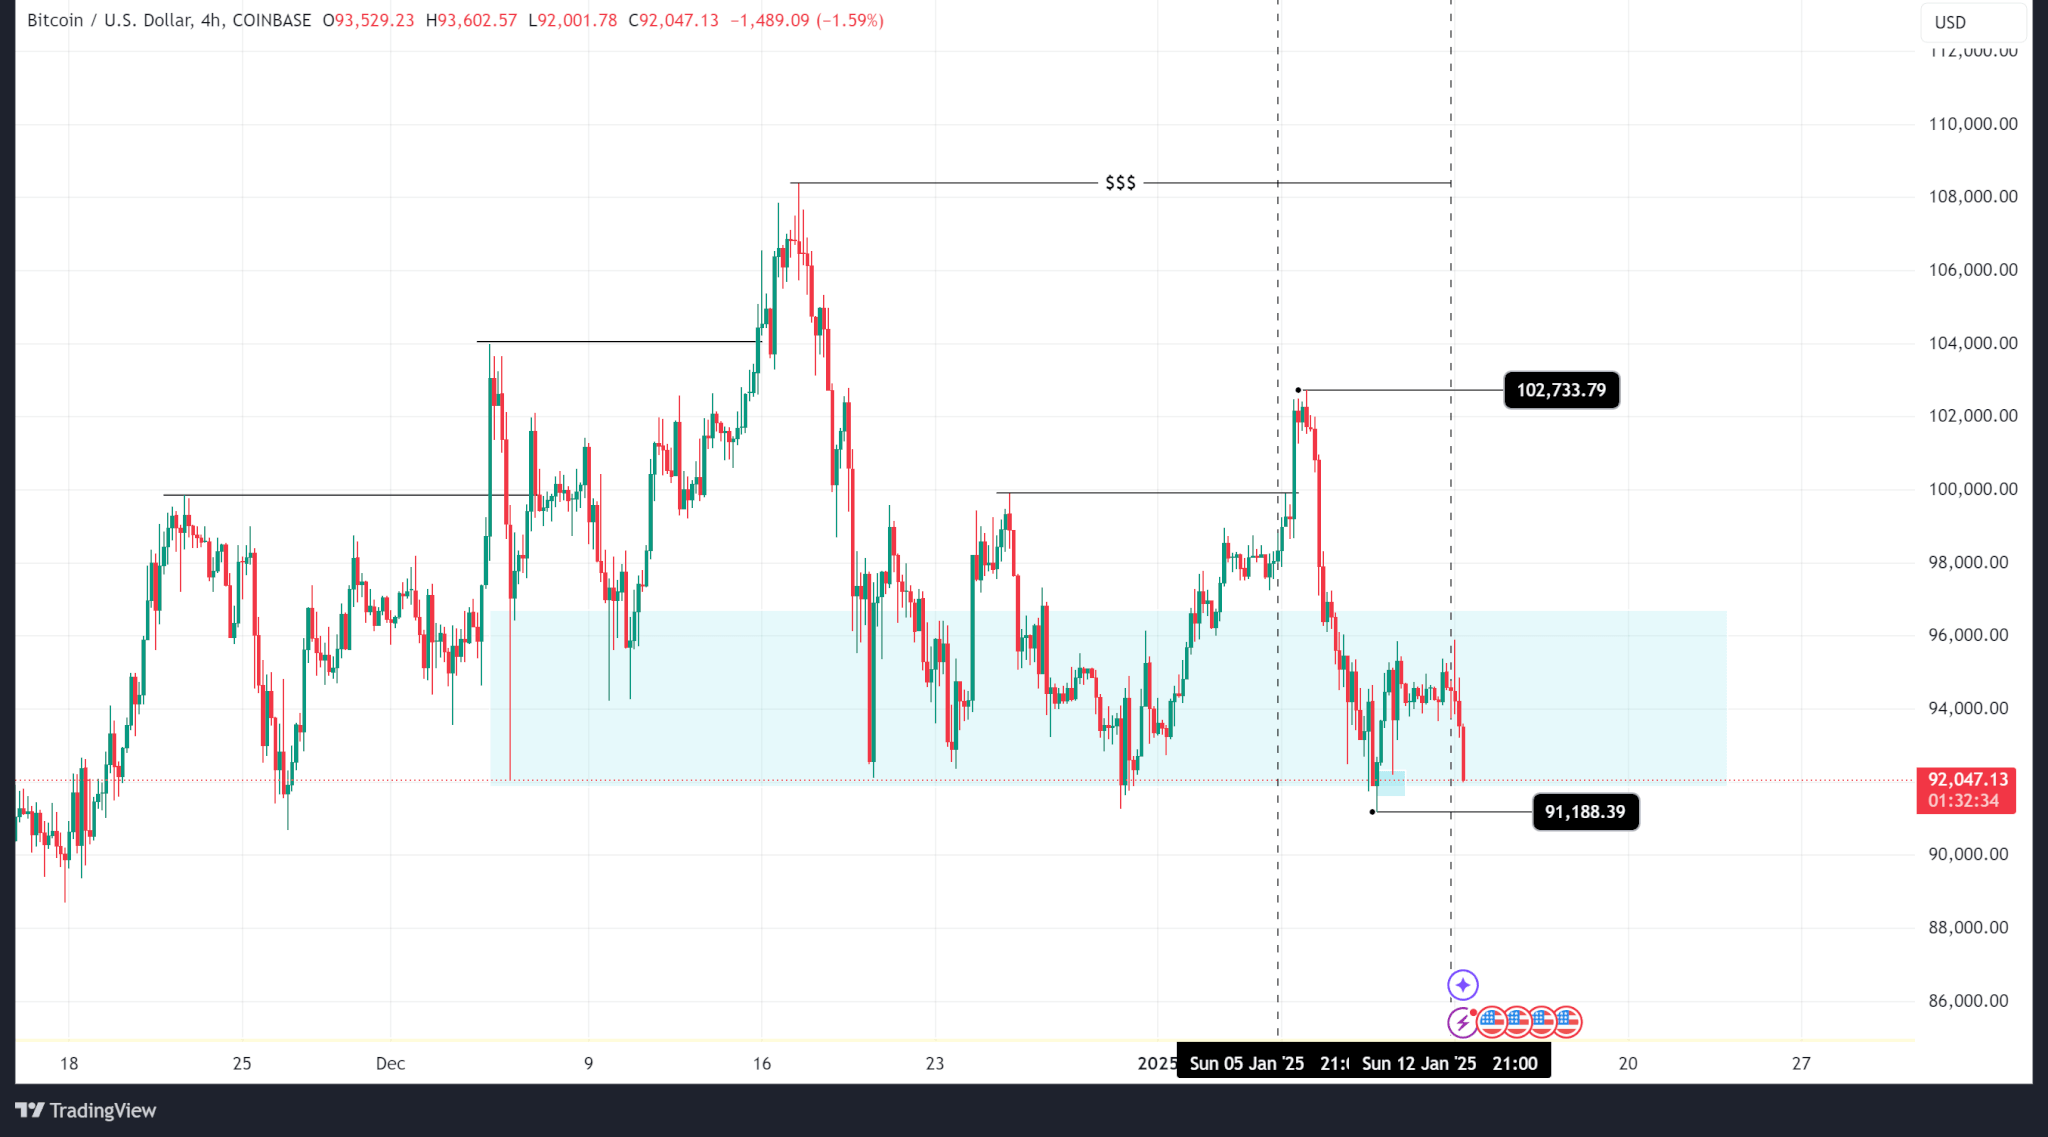
Much of this bearish sentiment is driven by the bleak economic outlook. Fed meeting minutes released on January 8 showed the Reserve Bank to be cautious about inflation expected to follow President Trump's policies.
This makes it less likely that interest rates will continue to be cut, with some analysts saying they expect them to end early this year. Market reaction reflects this latest risk-off sentiment.
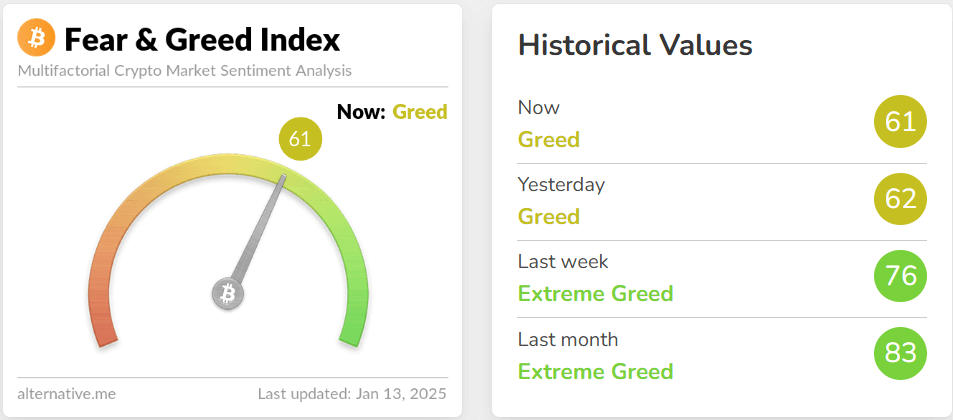

Bitcoin's open interest chart shows that the number of open interests has decreased between Wednesday and now. CME's open interest reached a weekly high of $18.16 billion on Tuesday, fell to a low of $16.55 billion on Thursday, and settled down for the rest of the week.


Meanwhile, the Spot Bitcoin ETF recorded outflows after the release of Wednesday's Fed meeting minutes. Outflows totaled $718.2 million, and inflows totaled $1.03 billion.
outlook
Bitcoin price is currently hovering near the bottom of the demand zone. If it falls below this, the price could fall to $85,100, with the fair value difference potentially acting as support.
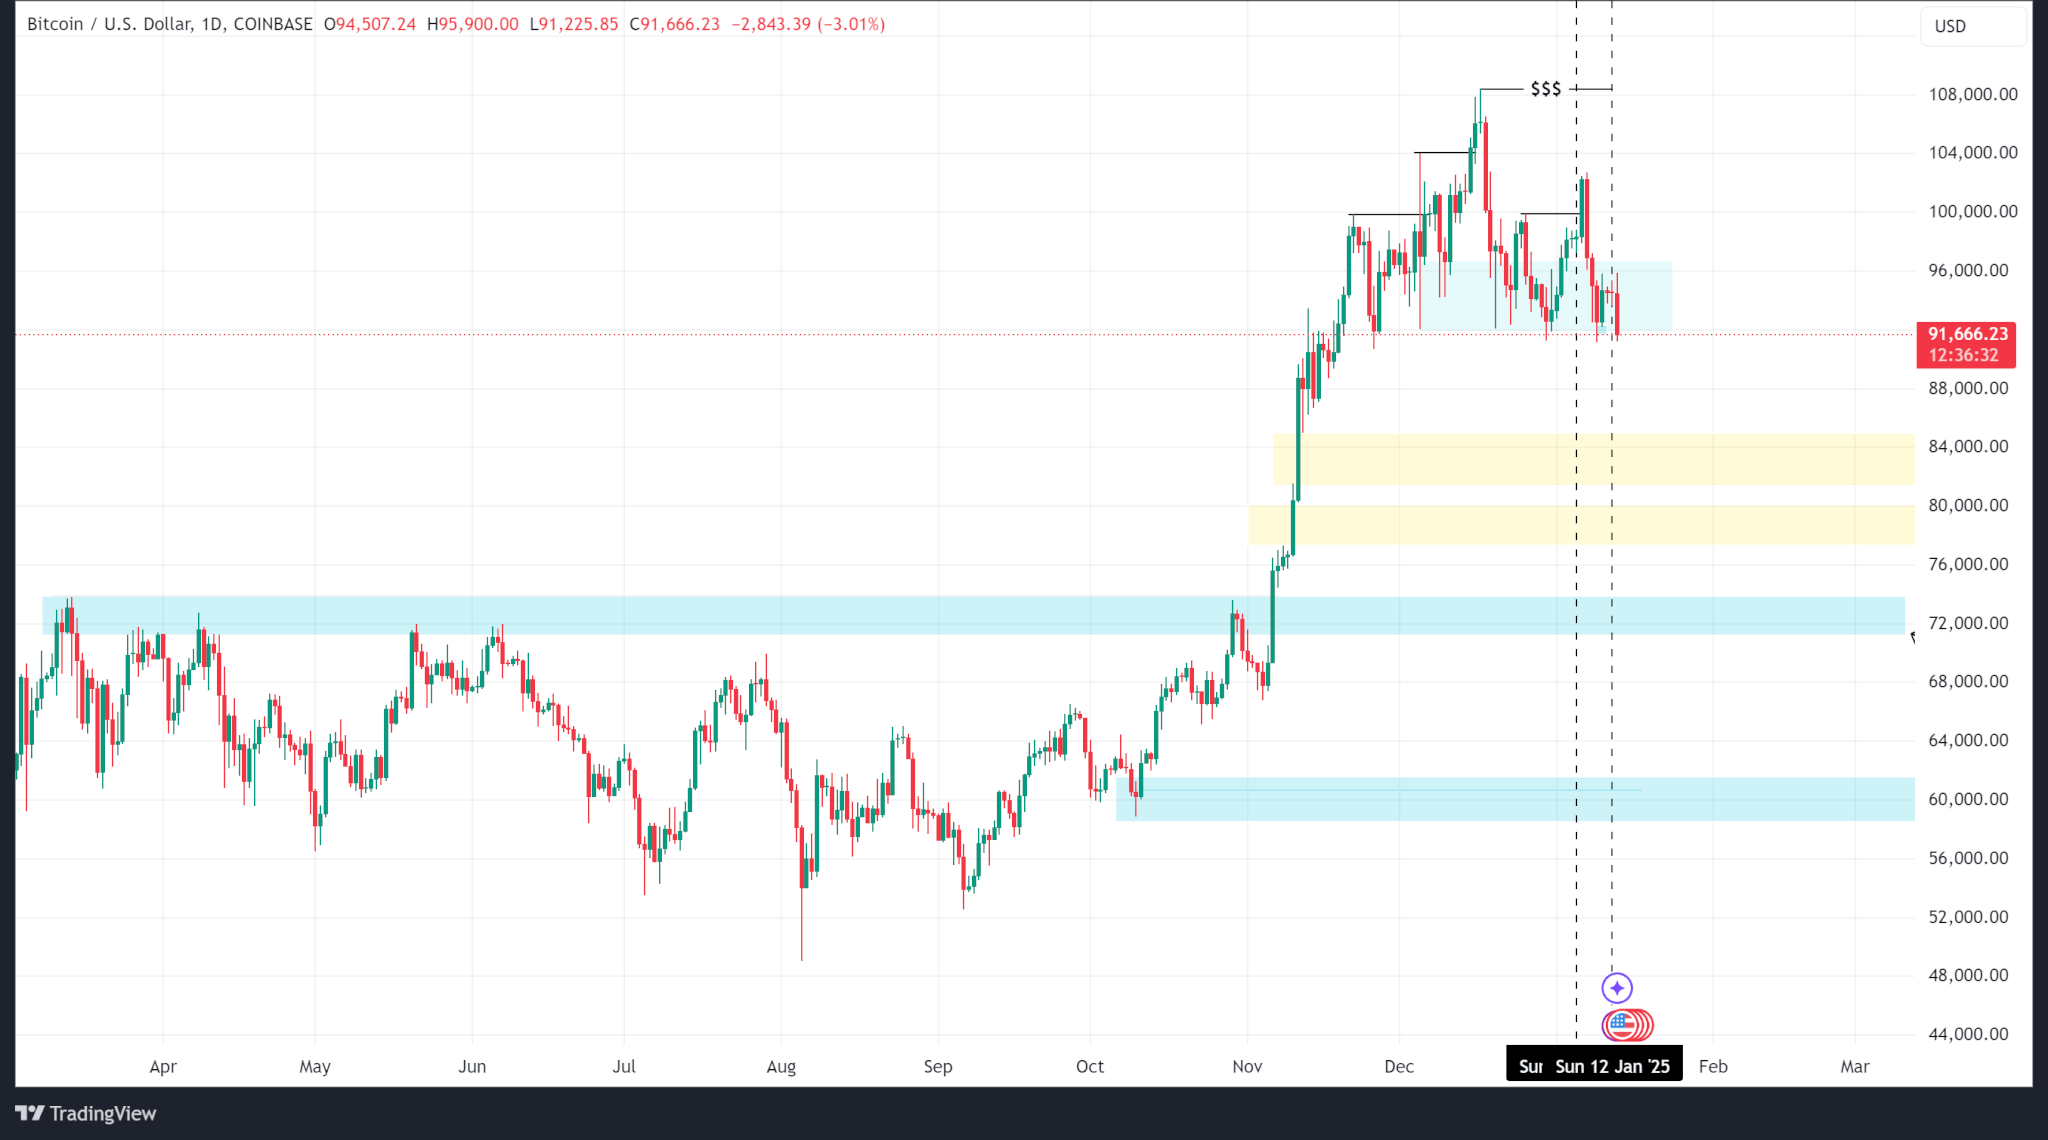

At the time of publication, BTC is trading at $91,622.
Ethereum
Ethereum price also turned negative this week, falling from a high of $3,744 to a low of $3,157, before closing at $3,236. ETH price trend tested the March 2024 high of $4,089 in early December 2024, but was unable to break above it and has been hitting lows ever since.
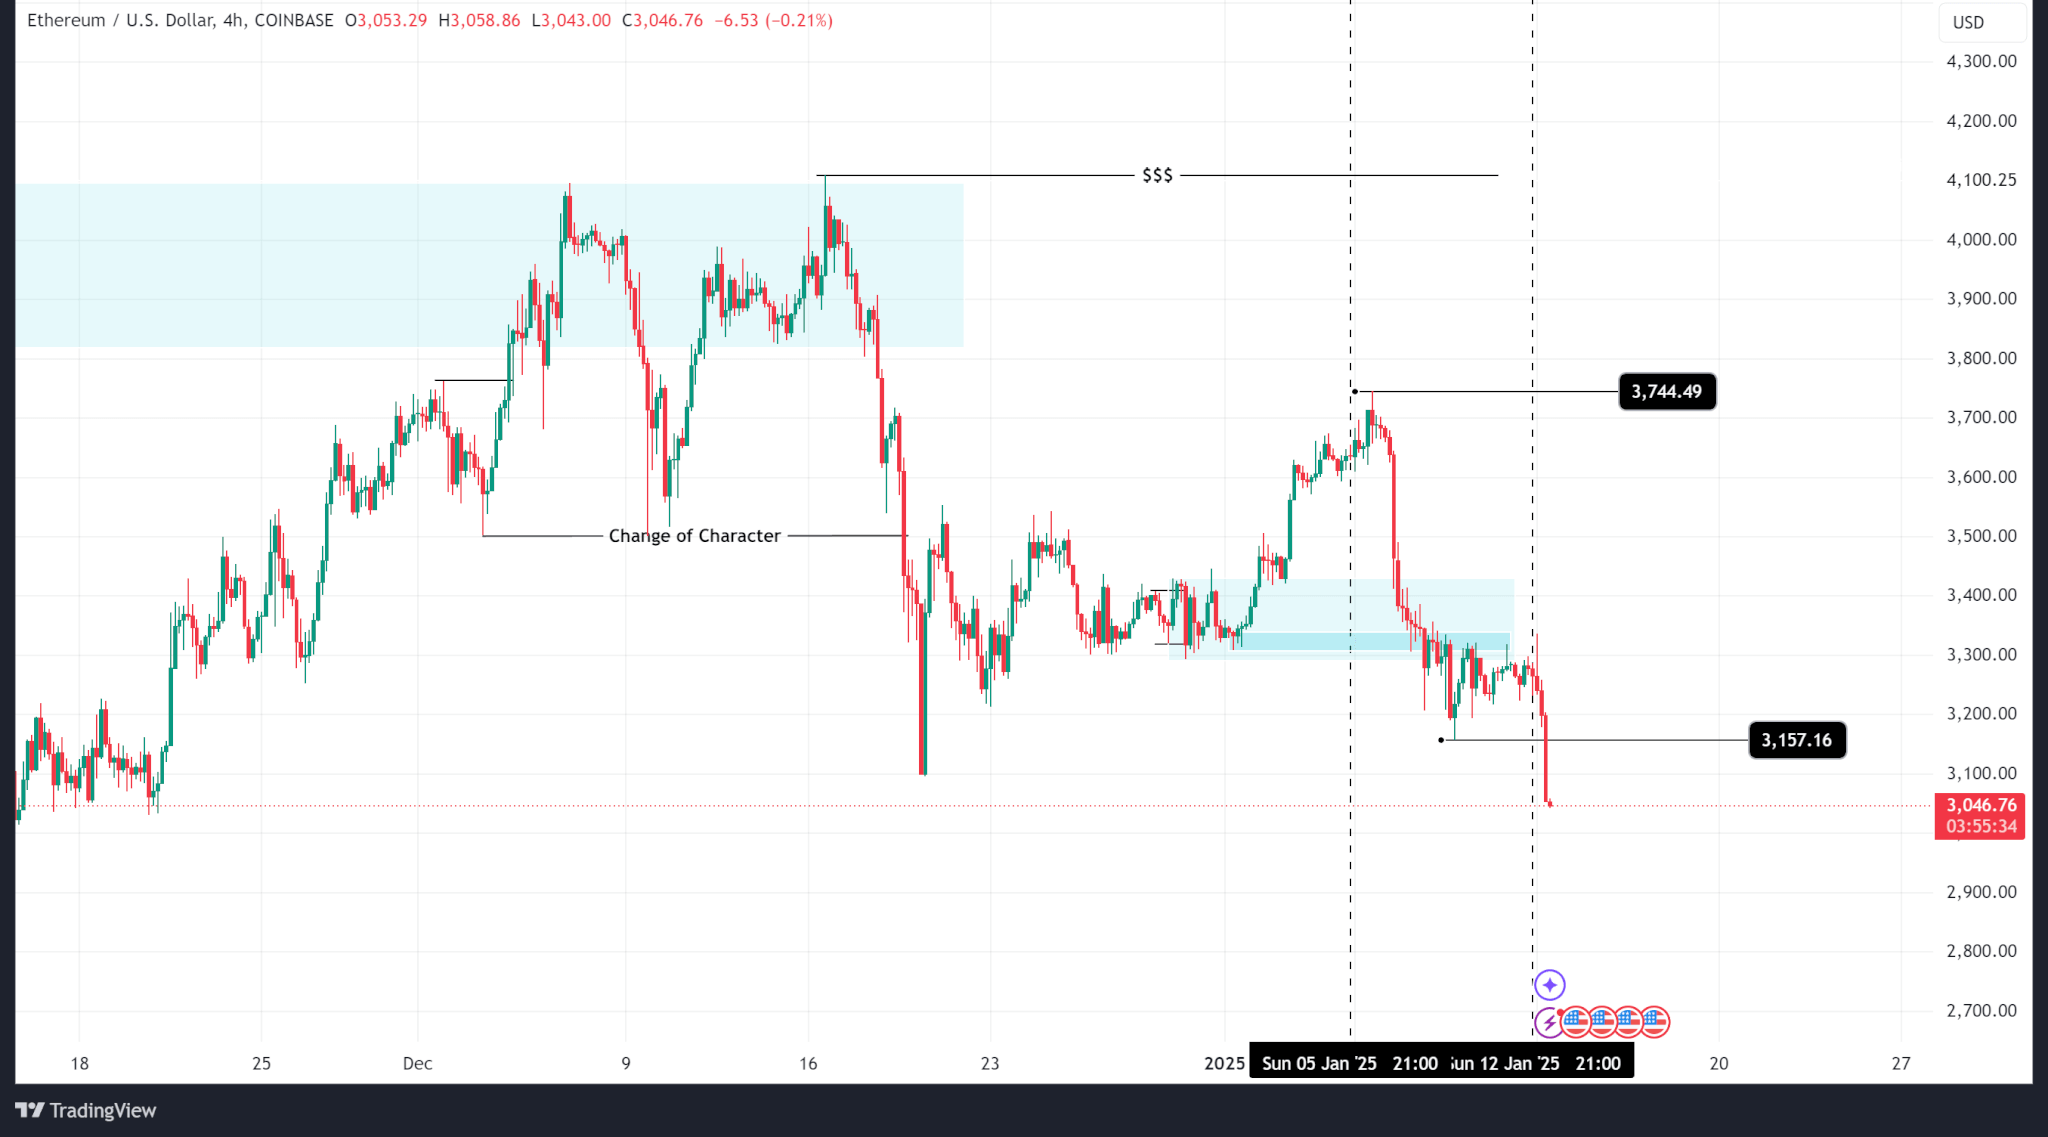

Open interest has declined from a high of $3.5 billion on January 7 and continued to decline to $2.63 billion as of this article.


Meanwhile, the Ethereum Spot ETF recorded net outflows of $186 million for the week due to the market's risk-off sentiment.
outlook
As Ethereum price continues its downward trend, the next technical level that could provide support is the fair value gap at the $2,893 price level.
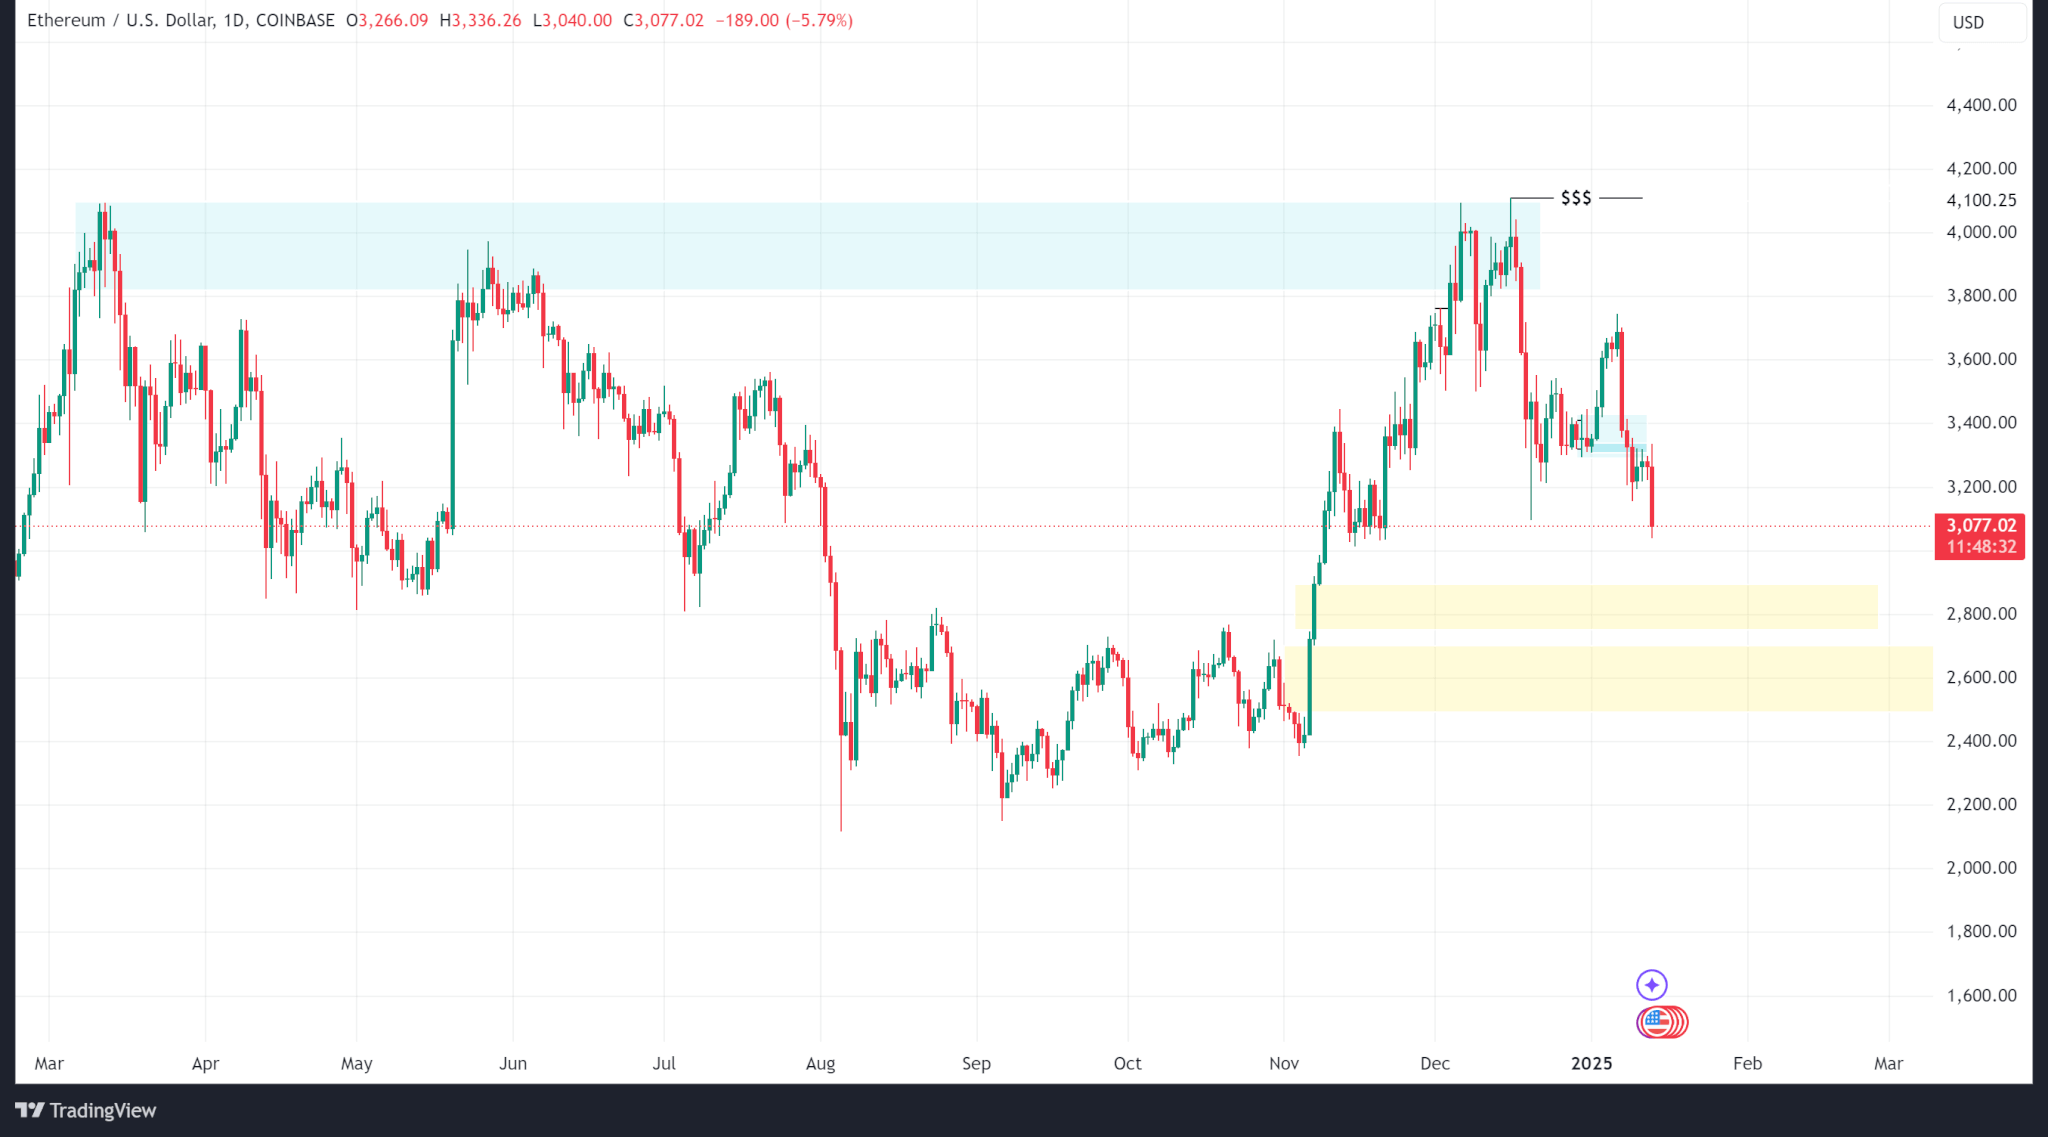

ETH is trading at $3,071 at the time of publication.
Solana
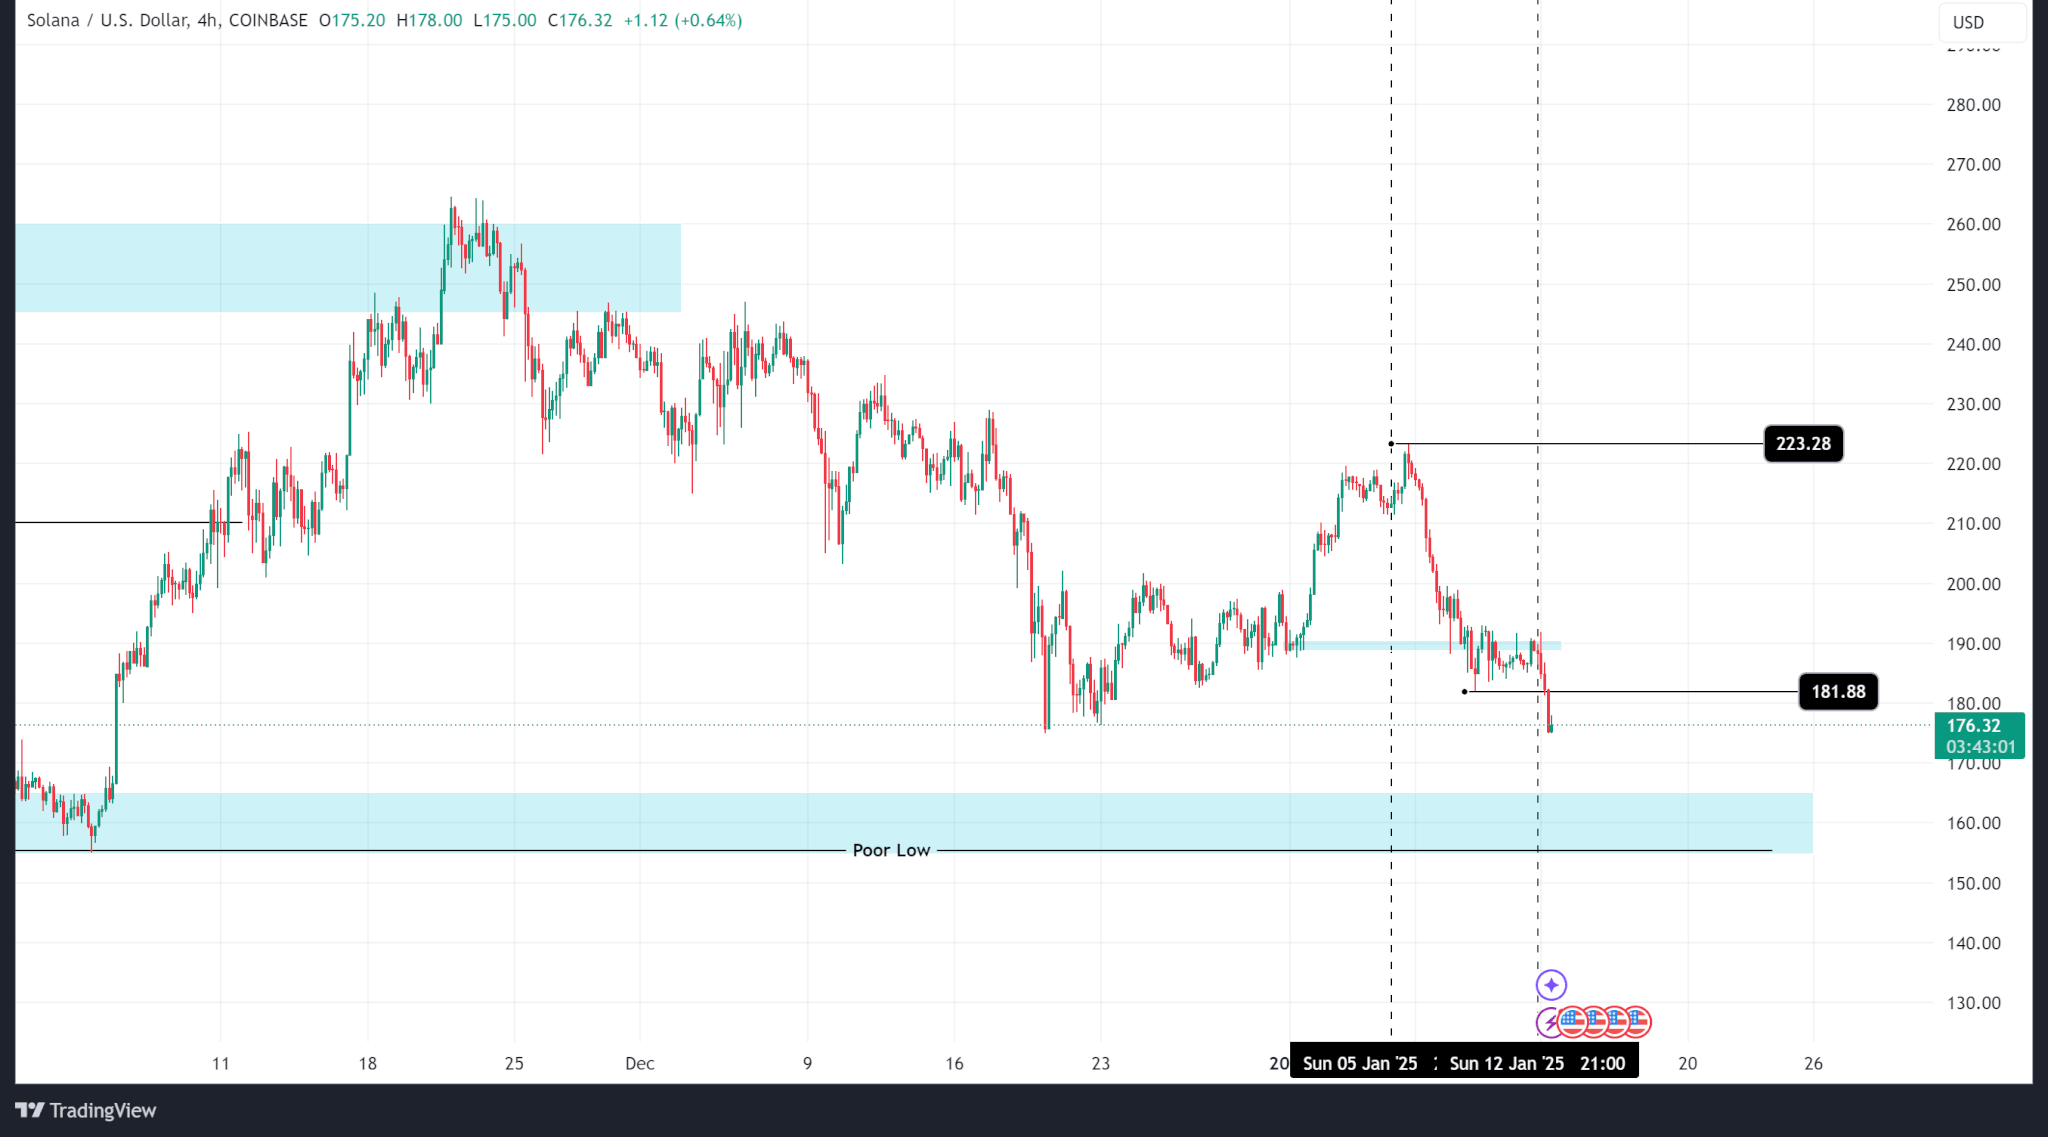
Solana’s price fell from a weekly high of $223 to a weekly low of $181, and finally closed at $188, for a total loss of 12.53%. SOL has been unable to surpass its all-time high of $260 and continues to trend downward.

According to open interest data, Binance saw a sharp decline from $1.89 billion on January 7th to $1.58 billion on January 10th. As of the publication of this article, the OI level has improved to $1.63 billion.


outlook
The next technical support zone is the $164 price level. However, although the order block is a support, it is a poor low that could fall even if the price reverses from that zone.
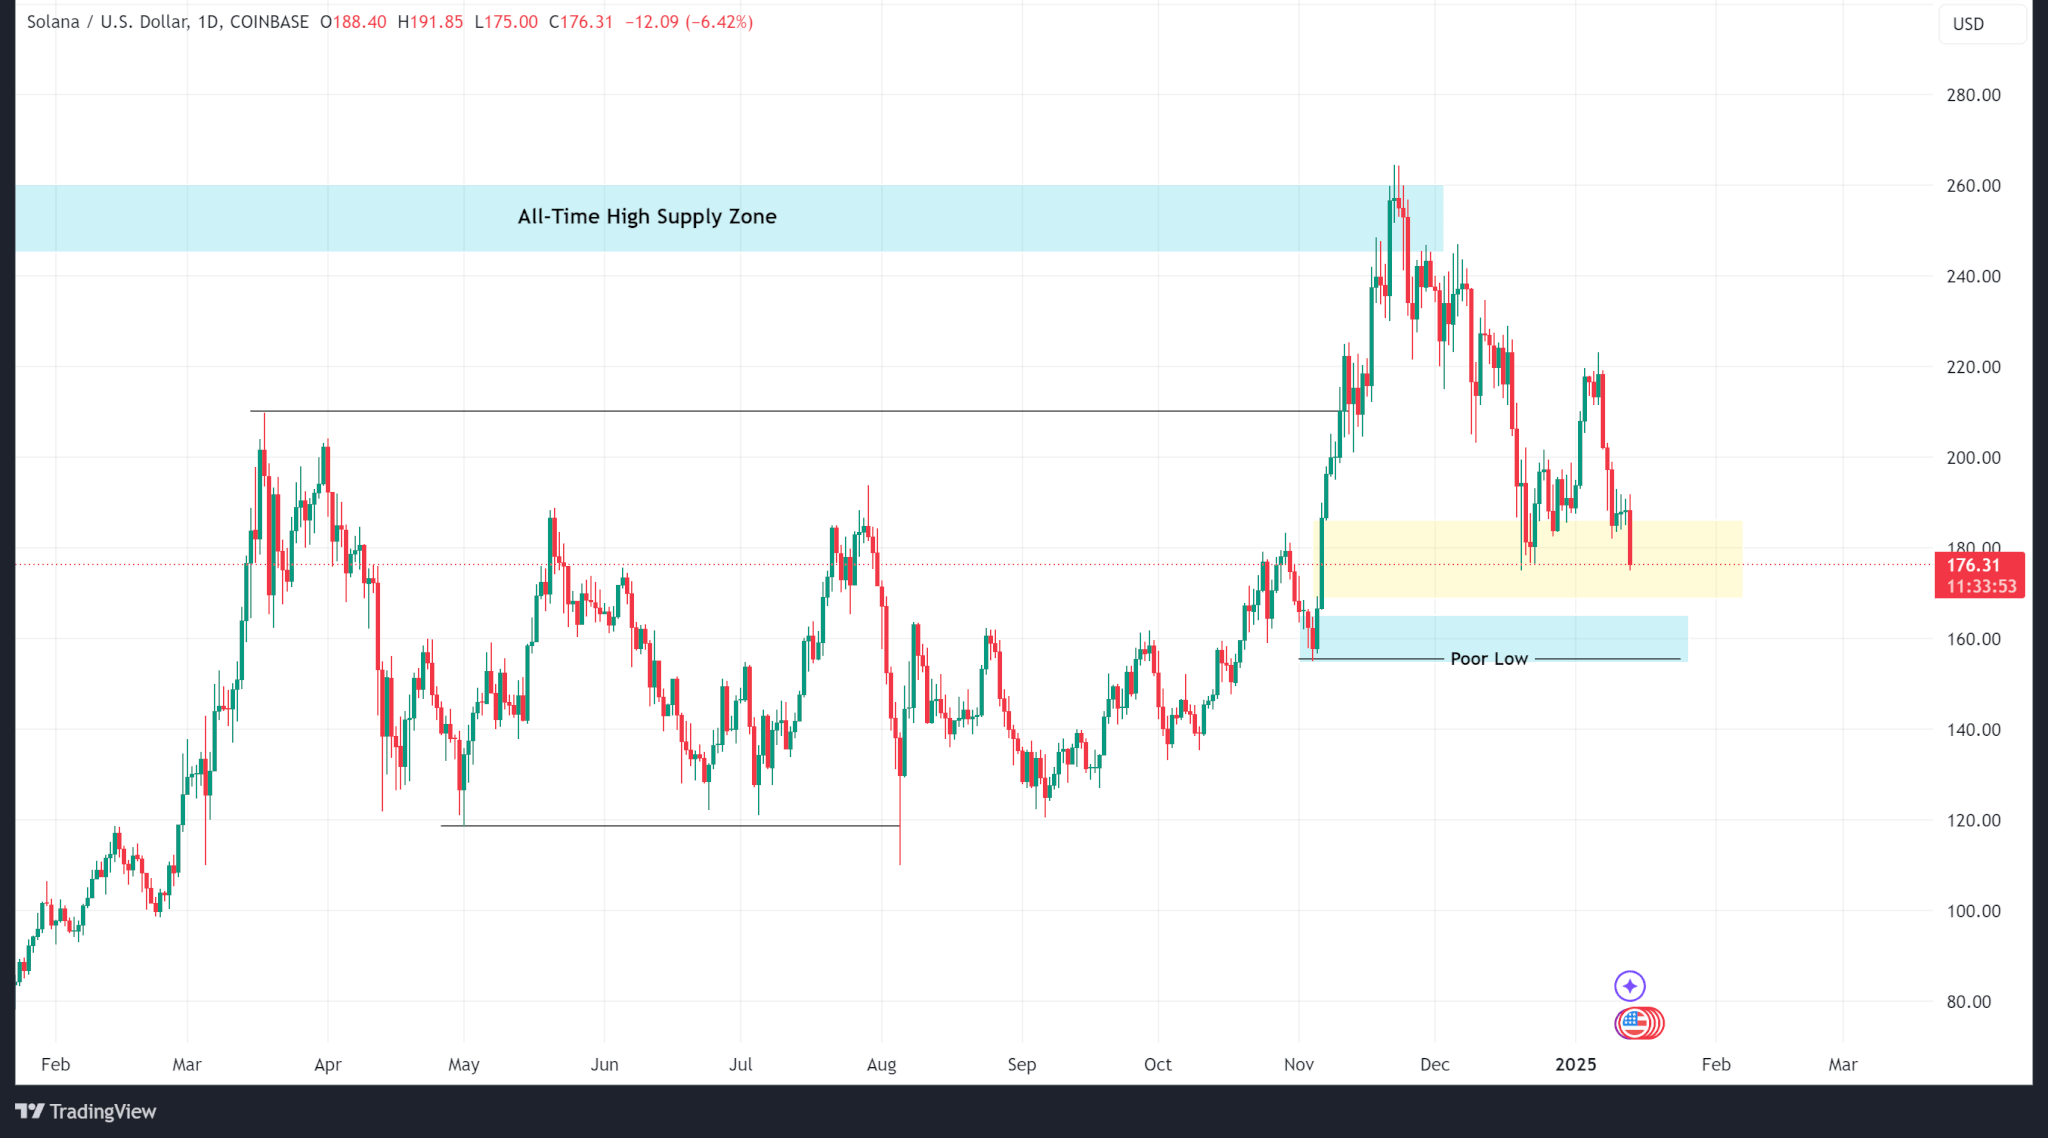

SOL is trading at $176 at the time of publication.
ripple
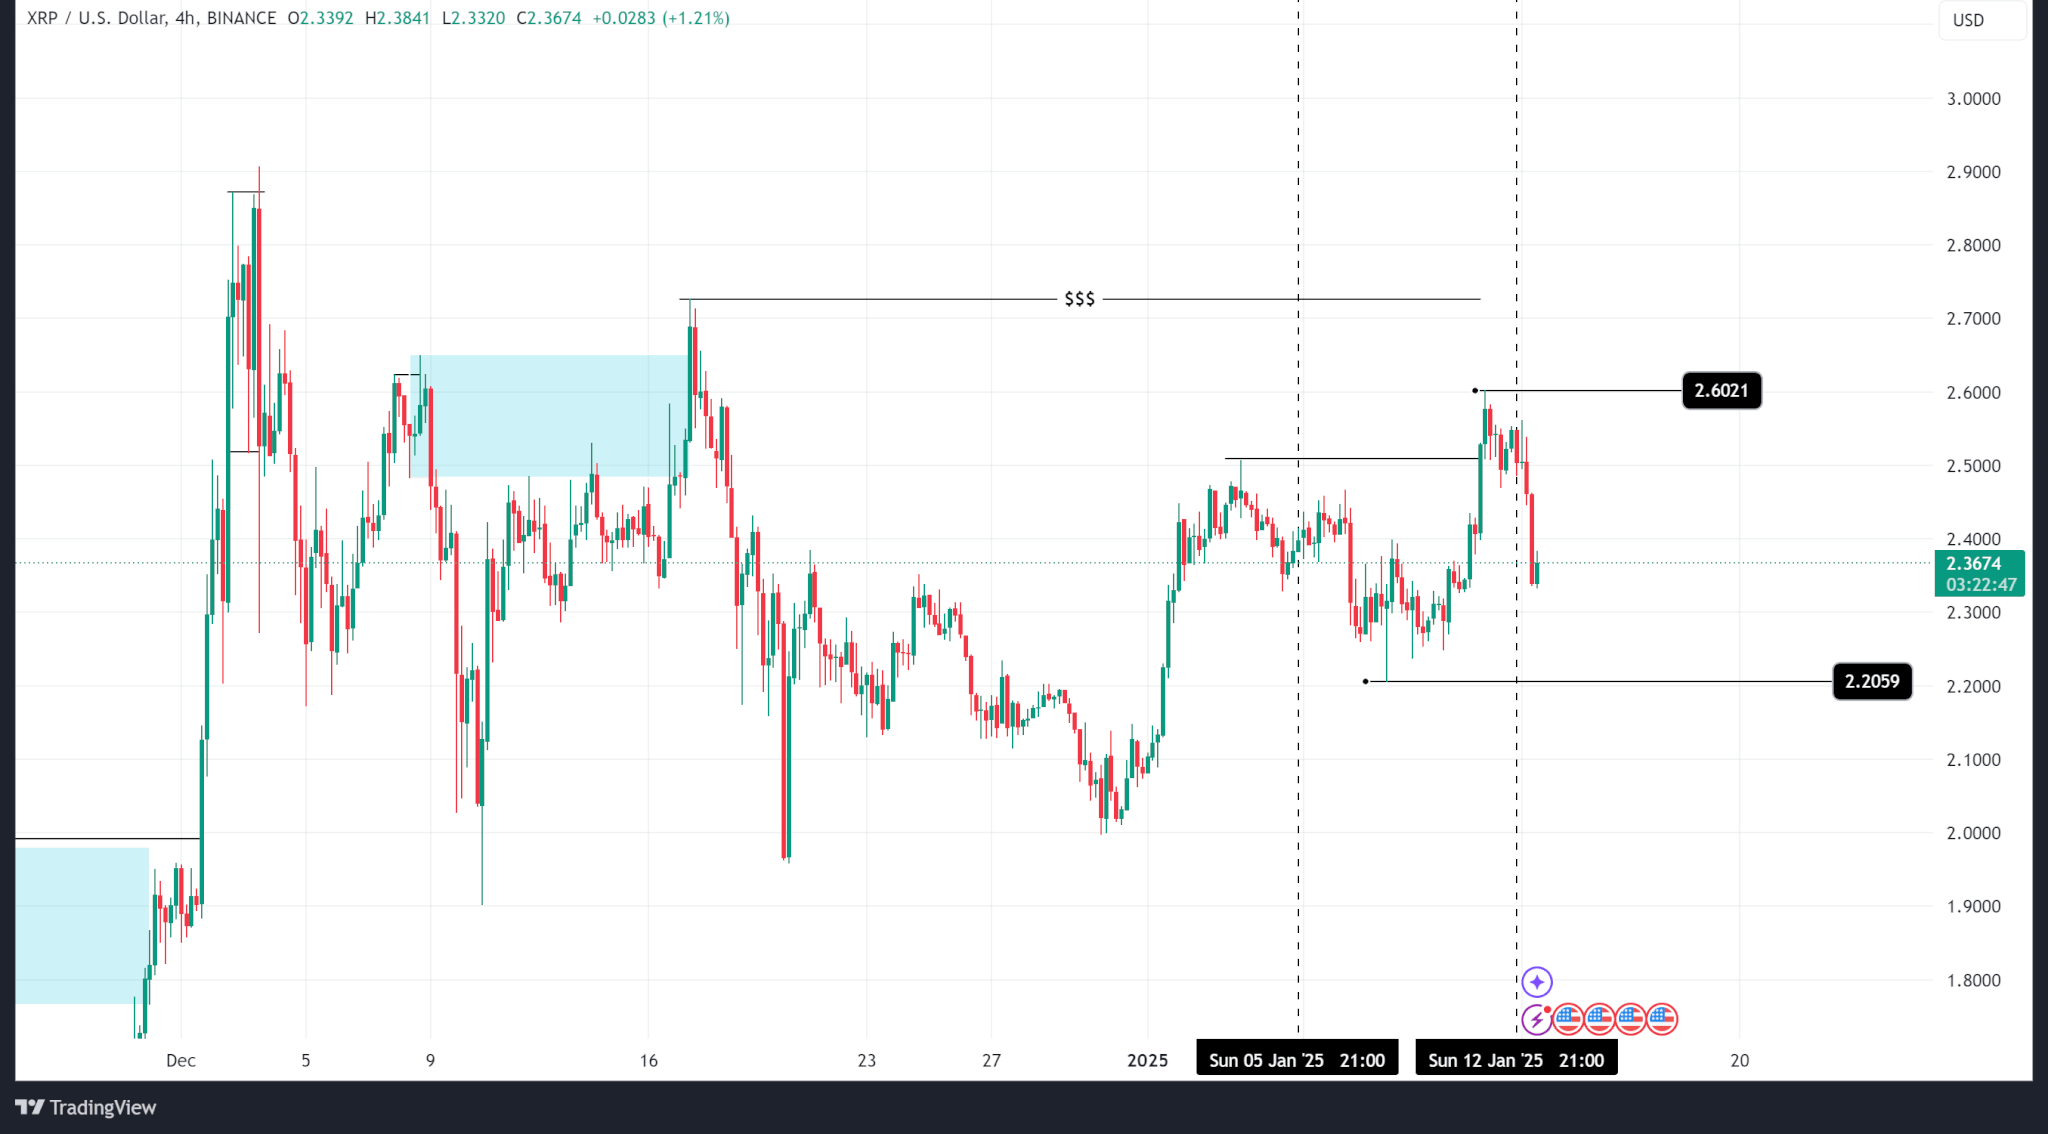
Ripple price did well last week, finishing at $2.55 from $2.38 at the beginning of the week as the price continued to make new highs. Zooming out, prices continue to hover between $1.90 and $2.90 as the market cools.

Open interest on BitGet, the exchange with the highest trading volume for XRP derivatives, rose last week, supporting the rally as positive news regarding Ripple's lawsuit with the SEC boosted sentiment.


outlook
Ripple's price has been rising on news surrounding an SEC lawsuit against its parent company, which could be abandoned with the outgoing administration.
However, technical analysis shows that XRP is trading at a premium and is expected to fall. The most likely levels are a fair value gap of $1.75 and an order block of $1.46.
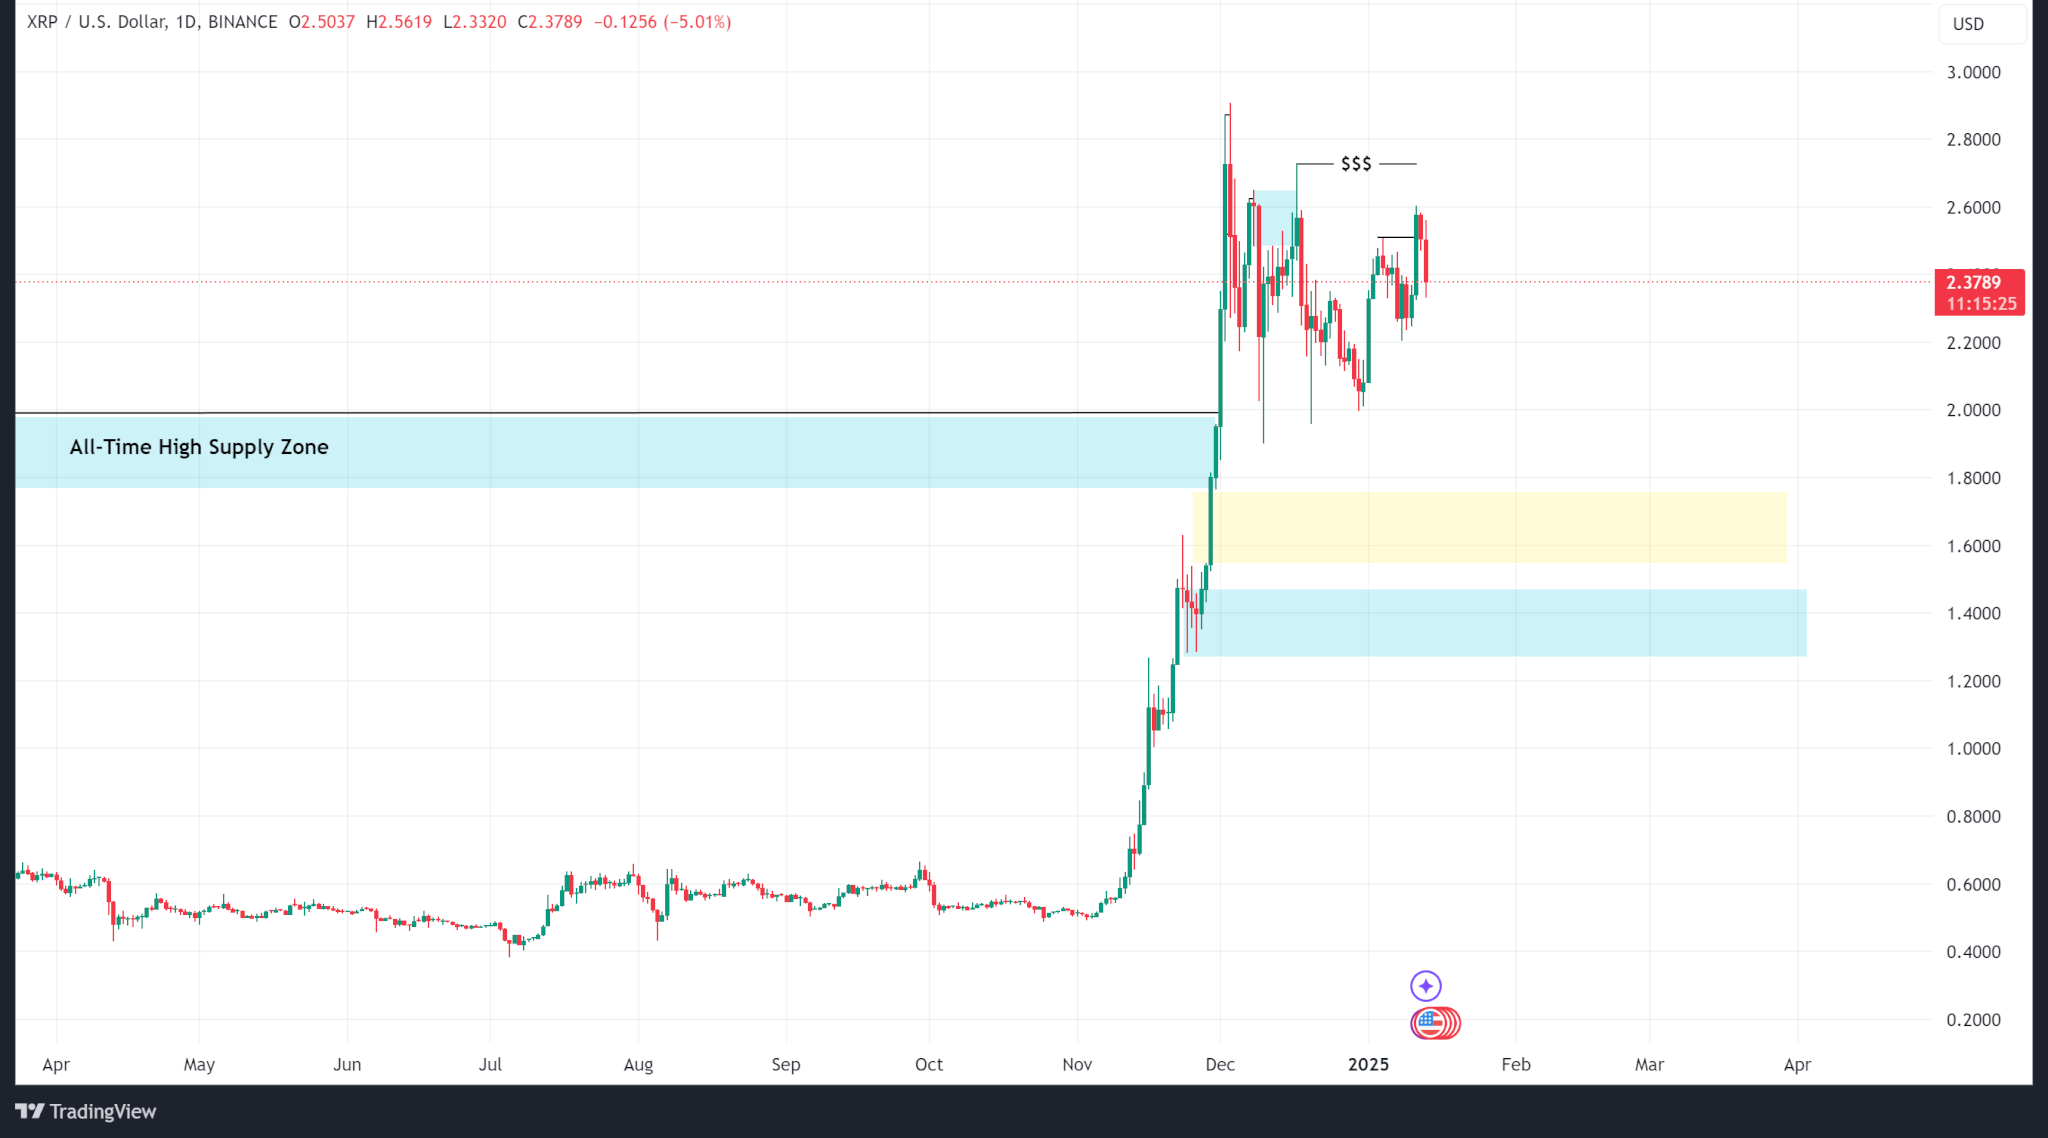

XRP is trading at $2.37 at the time of publication.

