Aave rose 14% to above $143, its highest level in five months.
Bitcoin surpassed $61,800, with a 4% rise in price as the cryptocurrency sees a renewed recovery.
Aave continued to outperform other cryptocurrencies on August 21, surging to a five-month high, while the price of Bitcoin rose 4% in 24 hours to surpass $61,800.
AAVE rises 14% to 5-month high
Decentralized finance (DeFi) protocol Aave (AAVE) was one of the biggest gainers on Wednesday, surging more than 14% to a high of $143. Aave's native utility and governance token hit this level amid massive whale activity over the past few days.
There was also good news for Aave after the DeFi project Aave V3 was deployed to the ZKsync Era Mainnet.
Aave V3 debuts on Era mainnet powered by @zksync, delivering unprecedented scalability, privacy & security while growing our DeFi user base & new institutional use cases. pic.twitter.com/blNlUjsalX
— Aave Labs (@aave) August 21, 2024
AAVE Price Prediction
Aave price has risen above $143, hitting its highest since March 2024, when Bitcoin was riding the halving mania and the spot BTC exchange-traded fund hit an all-time high.
AAVE’s rise to current levels means that the altcoin could be on the brink of a fresh rise towards the $177-$200 price range. However, the sudden increase in AAVE price has also shown a sell signal on the daily chart.
Crypto analyst Ari Martinez shared his price outlook for AAVE earlier in the day.
The last four times TD Sequential has issued a sell signal on the #AAVE daily chart, an average correction of 27% followed. The same sell signal is now in effect, signaling a possible pullback in $AAVE. pic.twitter.com/12yZwLT5tp
— Ali (@ali_charts) August 21, 2024
Bitcoin Bulls Aim for a Break Above $60,000
Bitcoin has lost momentum since the intense sell-off in early August, but bulls have largely remained undeterred, with buyers showing strong determination to push the price above $60,000.
Over the past 24 hours, the benchmark cryptocurrency has risen above this key level and now appears to be extending its slight advantage.
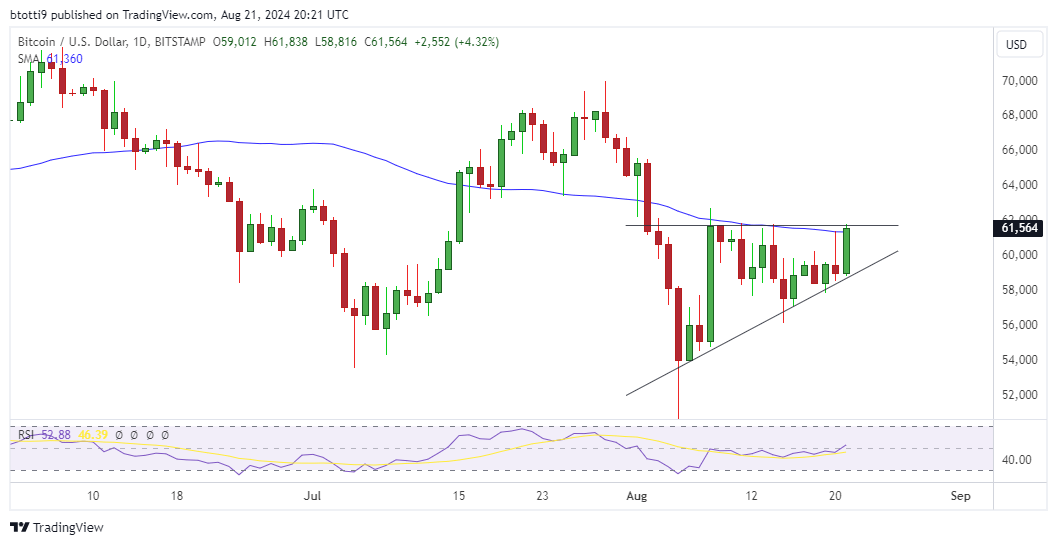
BTC hit an intraday high of over $61,838 on major cryptocurrency exchange Bitstamp.
BTC Chart
The rise saw the BTC/USD pair touch the 50-day simple moving average, highlighting the formation of an ascending triangle pattern. An ascending triangle is viewed by technical analysts as a bullish chart pattern where the resistance level follows a horizontal line.
Meanwhile, the swing low forms a triangle along the ascending trend line that narrows as the price turns upwards.

Bitcoin's daily chart suggests this has been the case for BTC since the drop to a low of $49,577 on August 5. Notably, the 50-day SMA is currently acting as a strong hurdle. If bulls decide to rise decisively, the price could target a key supply barrier around $68,255.
However, if weakness re-emerges, the key support areas could be near $58,266 and then $55,800.
